FLOW CHARTS
- OVERVIEW Brief description and understanding of flow charts.
- HISTORY A glimpse into the past of flow charting.
- INSTRUCTIONS How to gather data and develop a process flow.
- INTERPRETATION How to read a flow chart.
- EXAMPLE Simple example of flow chart and necessary symbols.
- SUGGESTED SOFTWARE
- RELATED TOPICS & SOURCES
OVERVIEW
- Quality Improvement Tool: Flow charts used specifically for a process.
- A flow chart is defined as a pictorial representation describing a process being studied or even used to plan stages of a project. Flow charts tend to provide people with a common language or reference point when dealing with a project or process.
- Four particular types of flow charts have proven useful when dealing with a process analysis: top-down flow chart, detailed flow chart, work flow diagrams, and a deployment chart. Each of the different types of flow charts tend to provide a different aspect to a process or a task. Flow charts provide an excellent form of documentation for a process, and quite often are useful when examining how various steps in a process work together.
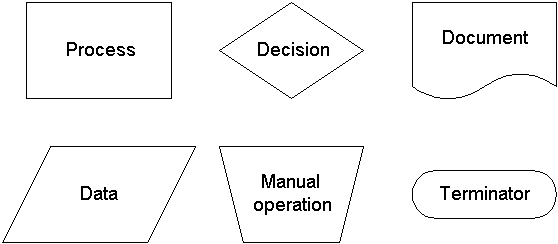
- When dealing with a process flow chart, two separate
stages of the process should be considered: the finished
product and the making of the product. In order to
analyze the finished product or how to operate the
process, flow charts tend to use simple and easily
recognizable symbols. The basic flow chart symbols below
are used when analyzing how to operate a process.
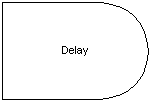
In order to analyze the second condition for a flow process chart, one should use the ANSI standard symbols. The ANSI standard symbols used most often include the following:
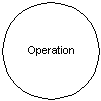 Drive
Nail, Cement, Type Letter.
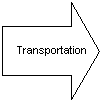 Move
Material by truck, conveyor, or hand.
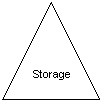 Raw
Material in bins, finished product on pallets, or filed
documents.
 Wait
for elevator, papers waiting, material waiting
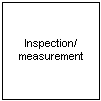 Read
gages, read papers for information, or check quality of goods.
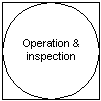 Any
combination of two or more of these symbols show an understanding
for a joint process.
| HISTORY | INSTRUCTIONS | INTERPRETATION | EXAMPLE | SOFTWARE | RELATED TOPICS |
HISTORY AND BACKGROUND
As a whole, flow charting has been around for a very long time. In fact, flow charts have been used for so long that no one individual is specified as the "father of the flow chart". The reason for this is obvious. A flow chart can be customized to fit any need or purpose. For this reason, flow charts can be recognized as a very unique quality improvement method.
| OVERVIEW | INSTRUCTIONS | INTERPRETATION | EXAMPLE | SOFTWARE | RELATED TOPICS |
INSTRUCTIONS
- Step-by-Step process of how to develop a flow chart.
- Gather information of how the process flows: use a)conservation, b)experience, or c)product development codes.
- Trial process flow.
- Allow other more familiar personnel to check for accuracy.
- Make changes if necessary.
- Compare final actual flow with best possible flow.
Note: Process should follow the flow of Step1, Step 2, ... , Step N.
Step N= End of Process
CONSTRUCTION/INTERPRETATION tip for a flow chart.
- Define the boundaries of the process clearly.
- Use the simplest symbols possible.
- Make sure every feedback loop has an escape.
- There is usually only one output arrow out of a process box. Otherwise, it may require a decision diamond.
| OVERVIEW | HISTORY | INTERPRETATION | EXAMPLE | SOFTWARE | RELATED TOPICS |
INTERPRETATION
- Analyze flow chart of actual process.
- Analyze flow chart of best process.
- Compare both charts, looking for areas where they are different. Most of the time, the stages where differences occur is considered to be the problem area or process.
- Take appropriate in-house steps to correct the
differences between the two seperate flows.
| OVERVIEW | HISTORY | INSTRUCTIONS | EXAMPLE | SOFTWARE | RELATED TOPICS |
EXAMPLE
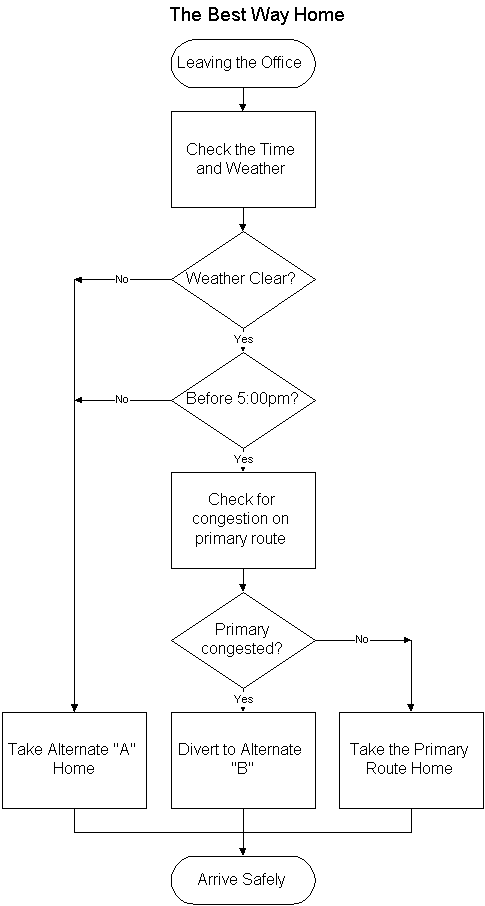
Process Flow Chart- Finding the best way home
This is a simple case of processes and decisions in finding the best route home at the end of the working day.
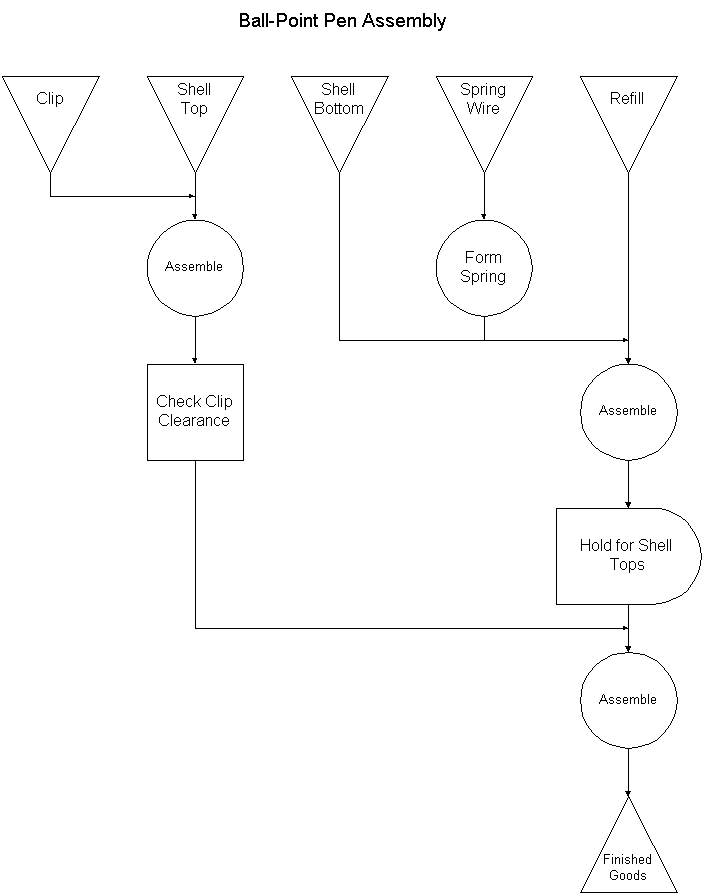
Process Flow Chart- How a process works
(Assembling a ballpoint pen)
| OVERVIEW | HISTORY | INSTRUCTIONS | INTERPRETATION | SOFTWARE | RELATED TOPICS |
SUGGESTED SOFTWARE
- In today's computer market, numerous software packages are available to produce process flow charts. The following is a listing of software packages designed specifically for flow charts. All of the packages listed are compatible with Microsoft Windows.
- ABC Flowcharter
- Corel Flow
- Visio
| OVERVIEW | HISTORY | INSTRUCTIONS | INTERPRETATION | EXAMPLE | RELATED TOPICS |
RELATED TOPICS & SOURCES
Practically all quality improvement tools have been developed from the flow chart. Some of these methods include:
- Cause and Effect Diagram
- Pareto Chart
- Histogram
- and many others...
Suggested sources for finding information dealing with flow charts:
- The Deming Management Method by Mary Walton
- Structured Analysis and System Specification by Tom DeMarco
- The Team Handbook by Peter R. Scholtes
| OVERVIEW | HISTORY | INSTRUCTIONS | INTERPRETATION | EXAMPLE | SOFTWARE |
